Note: This is an updated version of an article I wrote for Opensource.com. It contains some information on enhancements that allow glances to highlight and kill a process.
We SysAdmins have many tools that allow us to view and manage the running processes. For me, these used to be primarily top, atop, and htop, and glances. A few years ago, however, I found Glances, a new tool that displays information that none of my other favorites do. All of these tools monitor CPU and memory usage and most of them list information about running processes at the very least. However, Glances also monitors filesystem I/O, network I/O, and sensor readouts that can display CPU and other hardware temperatures as well as fan speeds, and disk usage by hardware device and logical volume.
Glances
I have briefly discussed glances in my article, 4 open source tools for Linux system monitoring, on Opensource.com, but I want to delve into it more deeply in this article. If you have read that article, some of this information may be familiar but you should also find some new things here as well.
Glances is cross-platform because it is written in Python. It can be installed on Windows and other hosts that have current versions of Python installed.
If Glances is not already installed on your system, you can do so now. Most Linux distributions, like Fedora in my case, have glances in their repositories. If not, or if you are using a different operating system altogether, such as Windows, or if you just want to get it right from the source, you can download and install it from https://glances.readthedocs.io/en/stable/index.html.
I suggest running Glances on a test machine as you try the commands in this article. If no physical host you can use for testing is available, you can explore Glances on a virtual machine but the hardware Sensors section will not display. After all, a VM has no real hardware.
To start Glances on a Linux host, open a terminal session and enter the command, glances. Let’s explore the three main sections of this tool.
Summary section
The summary section of Glances in the top few lines contains much of the same information as the summary sections of the other monitors. If you have enough horizontal space in your terminal session it can show CPU usage with both a bar graph and a numeric indicator, otherwise it will show only the number.
I like this summary section better than those of the other monitors like top; I think it provides the right information in an easily understandable format. The Summary section seen in Figure 1 is an overview of the system status. The first line shows the host name, The Linux distribution, the kernel version, and the system uptime.
The next four lines display CPU, memory usage, swap, and load statistics. The left column displays the percentages of CPU, memory, and swap space that are in use. In Figure 1 we see the combined statistics for all CPUs present in the system.
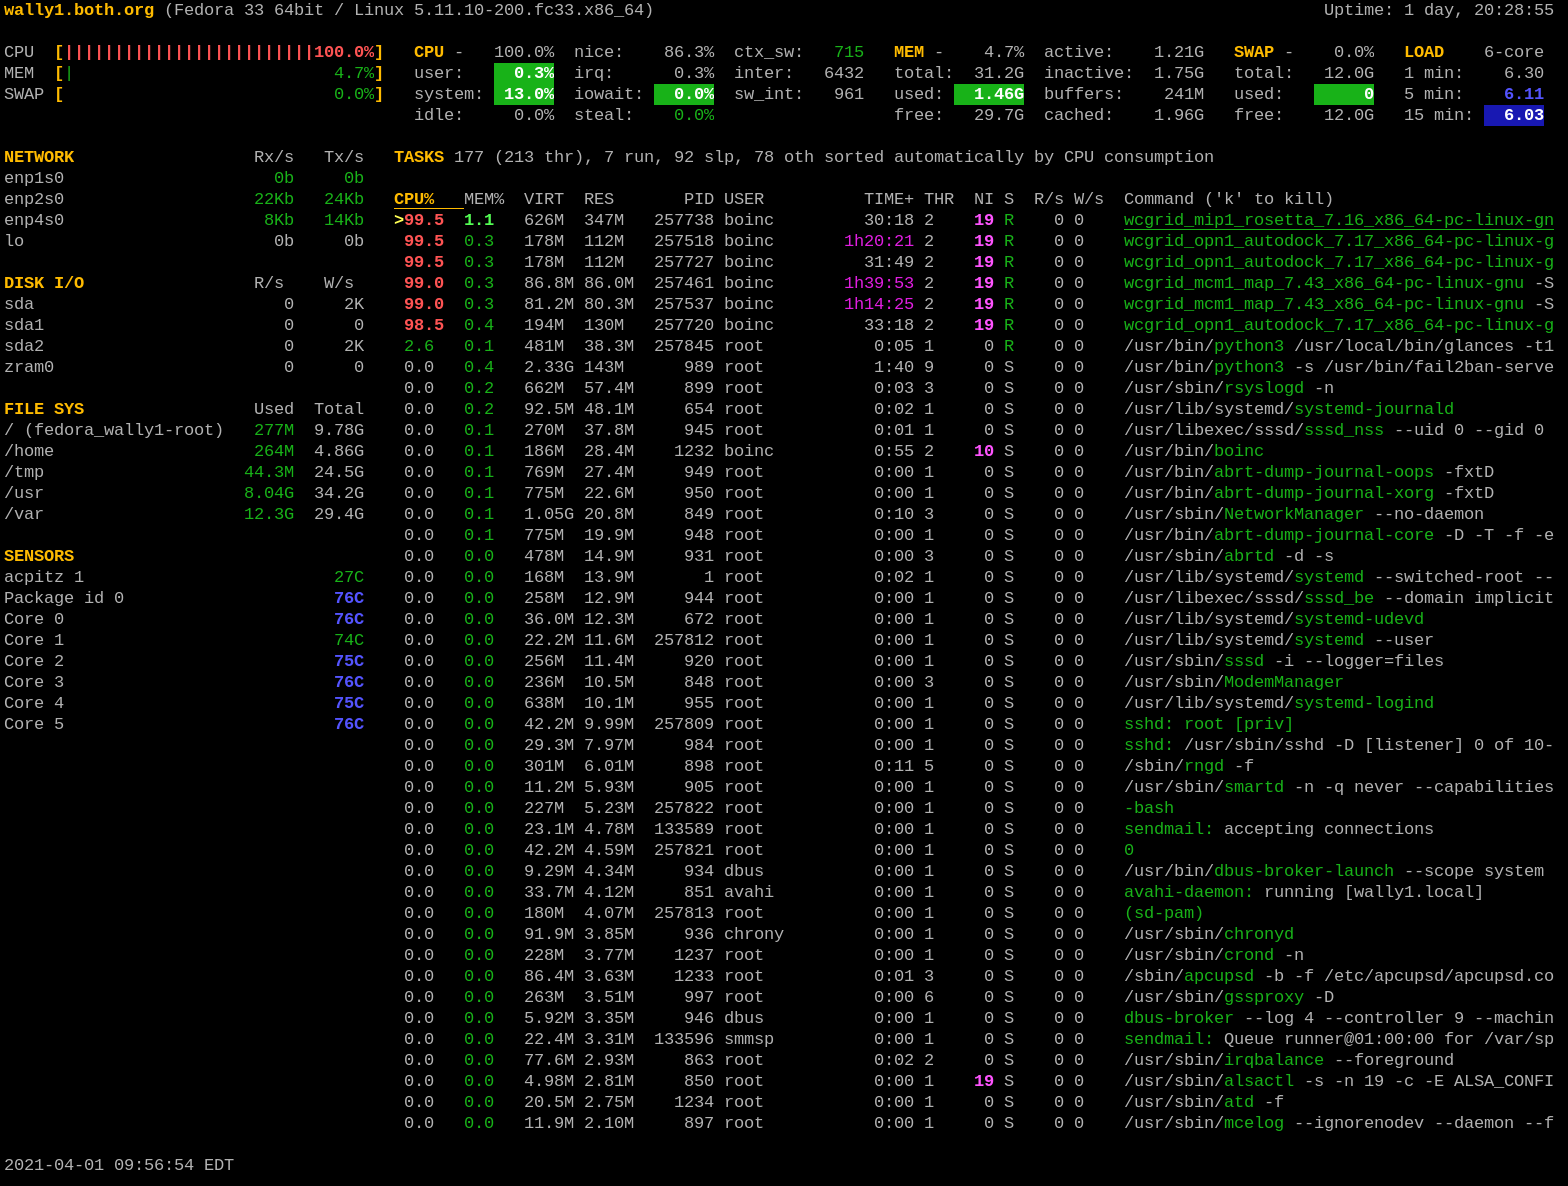
Figure 1: The Glances display on a busy Linux host.
Press the 1 key to toggle between the consolidated display of CPU usage and the display of the individual CPUs. Figure 2 shows the Glances display with individual CPU statistics.
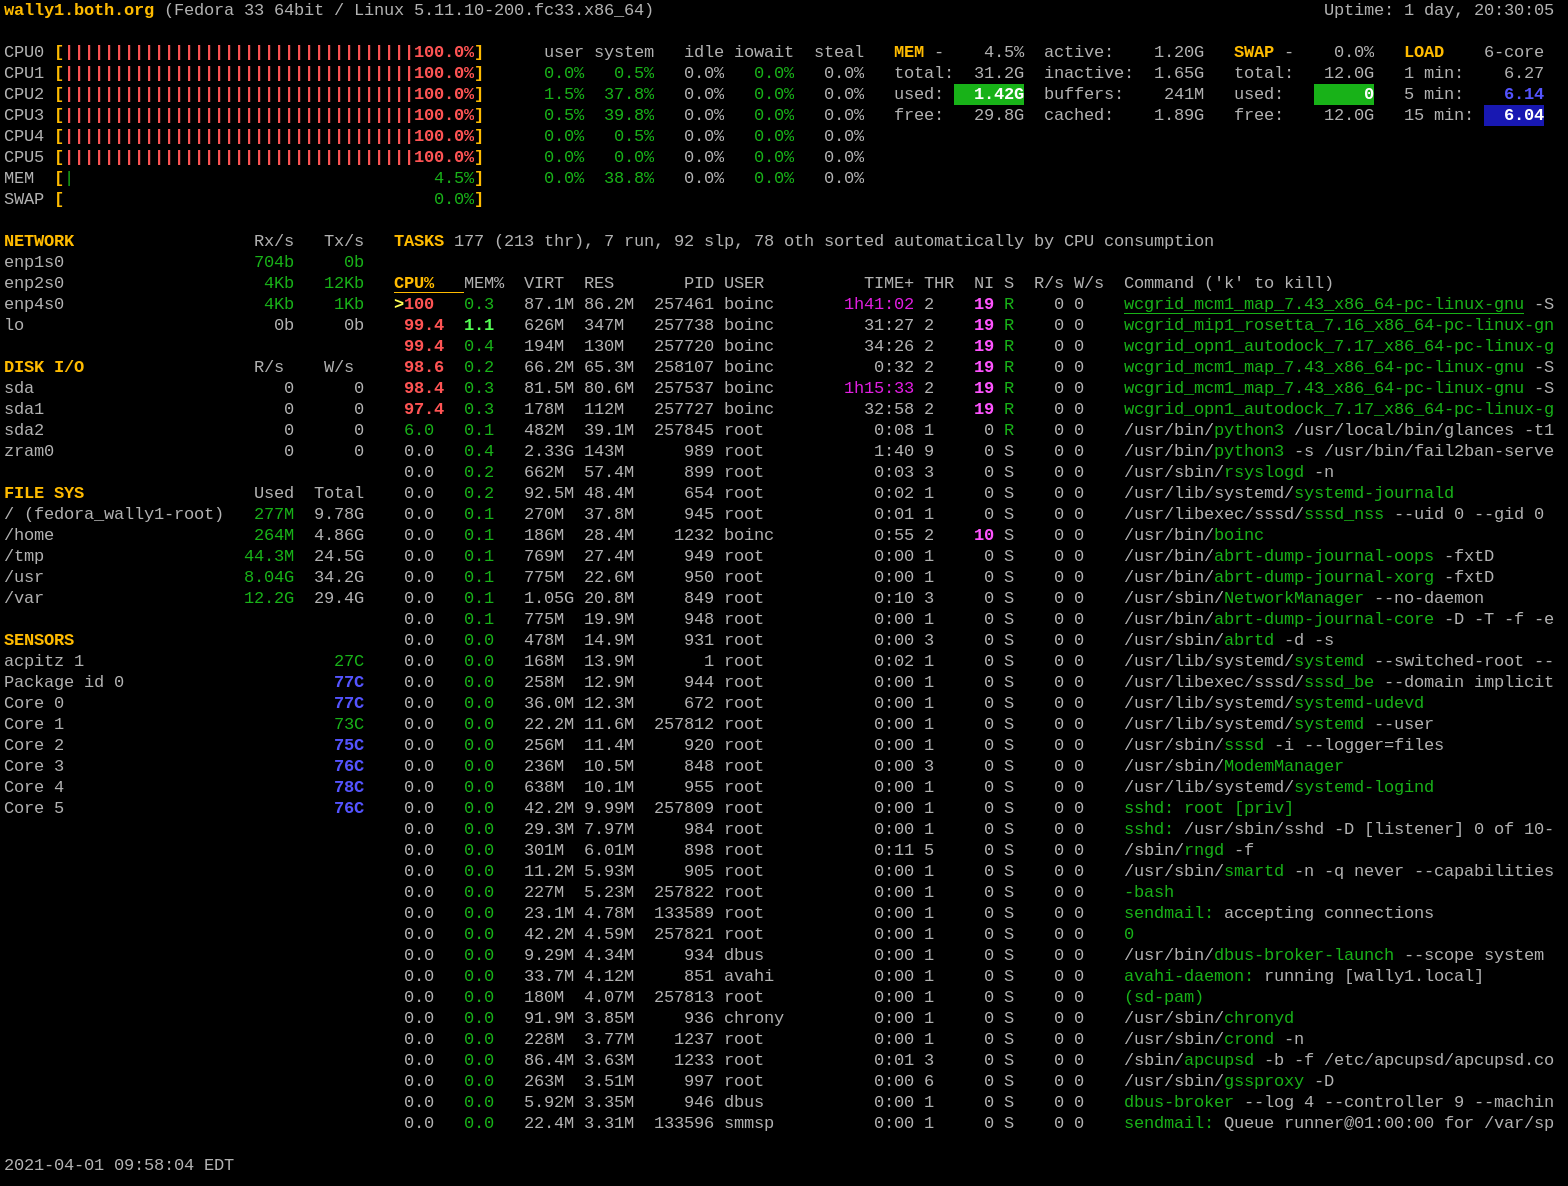
Figure 2: The Glances showing the individual CPU statistics.
In this view, some additional CPU statistics are available. The descriptions of all of the CPU usage fields in either display mode can assist in interpreting the data displayed in the CPU section. Notice that CPUs are numbers starting at 0.
- CPU: Current CPU usage as a percentage of the total available.
- user: Applications and other programs running in user space, i.e., not in the kernel.
- system: Kernel level functions. This does not include CPU time taken by the kernel itself, just the kernel system calls.
- idle: Idle time, i.e., time not used by any running process.
- nice: Time used by processes that are running at a positive nice level.
- irq: Interrupt requests that take CPU time.
- iowait: CPU cycles that are spent waiting for I/O to occur. This is wasted CPU time.
- steal: The percentage of CPU cycles that a virtual CPU waits for a real CPU while the hypervisor is servicing another virtual processor.
- ctx-sw: The number of context switches per second. This represents the number of times per second that the CPU switches from running one process to another.
- inter: The number of hardware interrupts per second. A hardware interrupt occurs when a hardware device such as a hard drive tells a CPU that it has completed a data transfer, or a network interface card is ready to accept more data.
- sw_int: Software interrupts also tell the CPU that some requested task has completed or that the software is ready for something. These tend to be more common in kernel level software.
The memory portion of the Summary section contains statistics about memory usage.
- MEM: Memory usage as a percent of the total amount available.
- total: The total amount of RAM memory installed in the host, less any amount assigned to the display adapter.
- used: The total amount of memory in use by the system and application programs but not including cache or buffers.
- free: The amount of free memory.
- active: The amount actively used memory. Inactive memory is subject to swapping to disk should the need arise.
- inactive: Memory that is in use but which has not been accessed for some time.
- buffers: Memory that is used for buffer space. This is usually used by communications and I/O such as networking. The data is received and stored until the software can retrieve it for use or it can be sent to a storage device or transmitted out to the network.
- cached: Memory used to store data for disk transfer until it can be used by a program or stored to disk.
The information in the Swap section is self-explanatory if you understand a bit about swap space and how it works. This section just shows how much total swap space is available, how much is used, and how much is left. The LOAD part of the Summary section displays the 1, 5 and 15 minute load averages. You can use the numeric keys 1, and 3 through 5 to alter the view of the data shown in this section. The 2 key toggles the left sidebar on and off.
More about load averages…
Before continuing let’s to discuss load averages in more detail because they are commonly misunderstood. Load averages are a key criteria for measuring CPU usage. But what does this really mean when I say that the 1 (or 5 or 10) minute load average is 4.04, for example? Load average can be considered a measure of demand for the CPU; it is a number that represents the average number of instructions waiting for CPU time. So this is a true measure of CPU performance, unlike the standard “CPU percentage” which includes I/O wait times during which the CPU is not really working.
For example, a fully utilized single processor system CPU would have a load average of 1. This means that the CPU is keeping up exactly with the demand; in other words it has perfect utilization. A load average of less than one means that the CPU is underutilized and a load average of greater than 1 means that the CPU is overutilized and that there is pent-up, unsatisfied demand. For example, a load average of 1.5 in a single CPU system indicates that one-third of the CPU instructions are forced to wait to be executed until the one preceding it has completed.
This is also true for multiple processors. If a 4 CPU system has a load average of 4 then it has perfect utilization. If it has a load average of 3.24, for example, then three of its processors are fully utilized and one is utilized at about 24%. In the example above, a 4 CPU system has a 1 minute load average of 4.04 meaning that there is no remaining capacity among the 4 CPUs and a few instructions are forced to wait. A perfectly utilized 4 CPU system would show a load average of 4.00 so that the system in the example is fully loaded but not overloaded.
The optimum condition for load average is for it to equal the total number of CPUs in a system. That would mean that every CPU is fully utilized and yet no instruction must be forced to wait. But reality is messy and optimum conditions are seldom met. If a host were running at 100% utilization, this would not allow for spikes in CPU load requirements.
The longer-term load averages provide indication of the overall utilization trend.
Linux Journal has an excellent article describing load averages, the theory, the math behind them, and how to interpret them in the December 1, 2006 issue. Unfortunately, Linux Journal has ceased publication and its archives are no longer available directly. The link to this article is to a third-party archive that contains all issues of Linux Journal.
CPU Hog
One of the reasons for using a tool like Glances is to find those processes that are taking up too much CPU time. In a different terminal session from the one running Glances, enter and start the following CPU hog command Bash program.
X=0;while [ 1 ];do echo $X;X=$((X+1));done
This program is a CPU hog and will use up every available CPU cycle. Allow it to run while you read this article and experiment with glances. It will provide you with an idea of what a program that hogs CPU cycles looks like. Be sure to observe the effects on the load averages over time as well as the cumulative time in the TIME+ column for this process.
Process section
The process section displays the standard information about each of the running processes. Depending upon the viewing mode and the size of the terminal screen, different columns of information will be displayed for the running processes. The default mode with a wide-enough terminal is to display the following columns.
The columns of the process section that are displayed changes automatically if the terminal screen is resized. The following columns are typically displayed for each process in this section from left to right.
- CPU%: The amount of CPU time as a percentage of a single core. So 98% represents 98% of the available CPU cycles for a single core. Multiple processes can show up to 100% CPU usage.
- MEM%: The amount of RAM memory used by the process as a percentage of the total virtual memory in the host.
- VIRT: The amount of virtual memory used by the process in human readable format such as 12M for Megabytes.
- RES: This refers to the amount of physical (resident) memory used by the process. Again this is in human readable format with an indicator of K, M, or G, to specify Kilobytes, Megabytes, or Gigabytes.
- PID: Every process has an identification number, the PID. This number can be used in commands such as renice and kill to manage the process. Remember that the kill utility can send other signals to a process besides just the “kill” signal.
- USER: The user name that is the owner of the process.
- TIME+: The cumulative amount of CPU time accrued by the process since it was started.
- THR: The total number of threads currently running for this process.
- NI: The nice number of the process.
- S: The current status which can be (R)unning, (S)leeping, (I)dle, T or t when the process is stopped during a debugging trace, or (Z)ombie. A zombie is a process that has been killed but which has not completely died and so continues to consume some system resources such as RAM.
- R/s and W/s Disk reads and writes per second.
- Command: The command that was used to start the process.
The default sort column is usually determined automatically by Glances. Processes can be sorted automatically (a), or by CPU (c), memory (m), name (p), user (u), I/O rate (i) or time (t). When sorted automatically, processes are first sorted by the most used resource. In the figures above, the TIME+ column is highlighted, which is the accumulated CPU time for the process.
Alerts
Glances also shows warnings and critical alerts at the very bottom of the screen, including the time and duration of the event. This can be helpful when attempting to diagnose problems when you cannot stare at the screen for hours at a time. These alert logs can be toggled on or off with the l (el) key, warnings can be cleared with the w key while alerts and warnings can all be cleared with x.
Sidebar
Glances has a very nice sidebar that displays information that is not available in top or htop. atop does display some of this data, but Glances is the only monitor that displays the sensors data. Sometimes it is nice to see the temperatures inside your computer. The individual modules, disk, filesystem, network, and sensors can be toggled on and off using the d,f, n, and s keys, respectively. The entire sidebar can be toggled using 2. Docker stats, if you are running it , can be displayed in the sidebar with D.
Note that the hardware sensors are not displayed when Glances is running on a virtual machine.
Getting help
You can get help by pressing the h key and dismiss the help page by pressing h again. The help page is rather terse but it does show the available interactive options and how to turn them on and off. The man page has terse explanations of the options that can be used when launching Glances.
You can press q or Esc to exit from Glances.
Configuration
Glances does not require a configuration file to work properly. If you choose to have one, the system-wide instance of the configuration file would be located in /etc/glances/glances.conf. Individual users can have a local instance at ~/.config/glances/glances.conf which will override the global configuration. The primary purpose of these configuration files is to set thresholds for warnings and critical alerts. You can also specify whether certain modules are displayed by default or not.
The file /usr/local/share/doc/glances/README.rst contains additional useful information including optional Python modules that would need to be installed to support some of the optional Glances features.
Command line options
Glances provides command line options that allow startup in specific viewing modes. For example the command glances -2 starts the program with the left sidebar disabled.
Remote and more
Glances can be used to monitor remote hosts by starting it in server mode.
[root@testvm1 ~]# glances -s
You can then connect to the server from the client with the following.
[root@testvm2 ~]# glances -c @remoteserver
Glances can show a list of glances servers along with a summary of their activity. It also has a web interface so that remote glances servers can be monitored from a browser. Recent versions of Glances can also display Docker statistics.
There are also pluggable modules for Glances that provide measurement data not available from the base program.
Killing a process
If you need to kill a process, you can use the up/down arrow keys to move the underline highlight to a process to kill. Then press k.
Let’s try it. The CPU hog command line program that you started earlier should still be running. Open another non-root terminal session and start another instance of the CPU hog program that you started earlier. Open another terminal session and su – to root. Position this new terminal session near the terminal session that is already running the CPU hog so that they can both be seen simultaneously.
Now open another terminal session as the student user and run the same program in it. You should now have two instances of this program running. Notice in glances that the two processes tend to get about the same amount of CPU time on average. Sometimes one gets more than the other and sometimes they get about the same amount. Figure 3 shows the results in top when two of these CPU hogs are running. Note that I have logged in remotely using SSH and am using the screen program to perform these experiments on the VM so both of those tools show up with HIGH CPU usage in Figure 3. You should not have those two entries in your top output. The results you see are essentially the same.
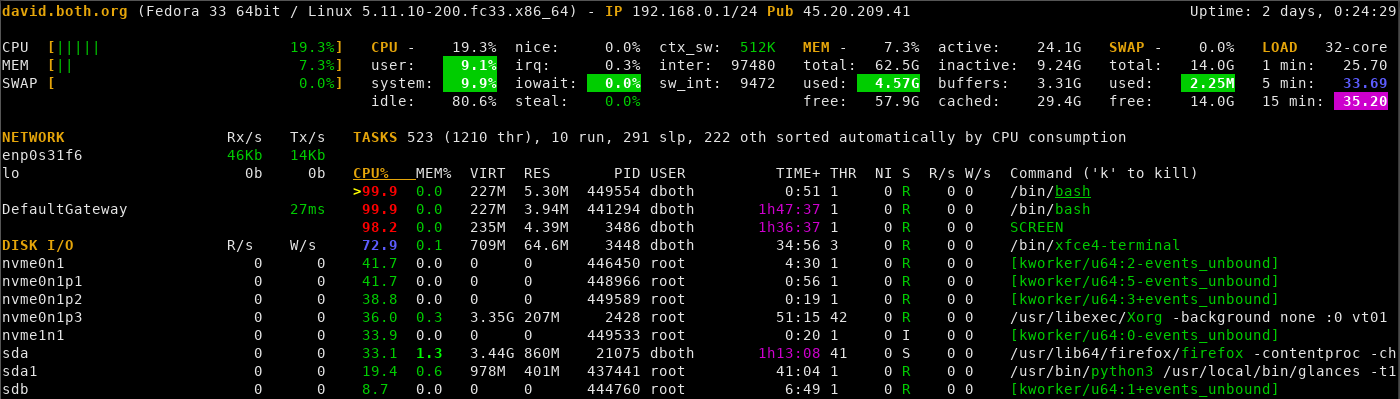 Figure 3: The two CPU hogs show up with their high CPU usage.
Notice in Figure 3 that there the CPU% column shows a > (greater-than) symbol next to the top process which also happens to be one of the processes we want to kill. It is very difficult to see in Figure 3, but the name of the program is underlined. In this case all we see is the /bin/bash shell for these to processes because we just ran the CPU hogs as unnamed command line programs.
If necessary to find the process you need to kill, you can use the up/down arrow keys to find and highlight it. You cannot move down past about the 47th process. Well – is was the 47th on my system. That might be different for yours. The highlight just won’t go any further. But this should not be a problem much of the time because the processes we are most interested in and need to kill are the ones sucking up CPU resources.
When you have found the process you want to kill and highlighted it, press k. Glances will then display a confirmation dialog like the one in Figure 4.
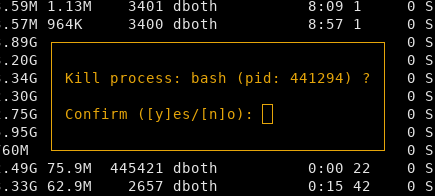
Figure 4: Glances displays this confirmation dialog when you kill a process.
Type y, press Enter, and the process will be killed. Now do the same to kill the other CPU hog. Both of the Bash sessions are terminated, not just the running command line program.
Limitations
Although Glances can monitor many aspects of a host, it cannot be used to manage processes. It cannot change the nice number of a process , for example, like top and htop. You cannot kill a process by its process ID (PID), you must highlight it before pressing k. You cannot choose which signal to send to the process such as SIGKILL, SIGTERM, or SIGINT. Glances appears to use SIGKILL (signal 9) by default on all processes. Glances is not an interactive tool. Except for killing a process, glances is used strictly for monitoring. External tools like kill and renice can be used to manage processes.
Glances can only show the processes that are taking the most of the resource specified, such as CPU time, in the available space. If there is room for only ten processes to be listed that is all you will be able to see. Glances does not provide for any scrolling or reverse sort in order to see any other than the processes shown in the number of lines the terminal has available.
The impact of measurement
The observer effect is a theory in the scientific discipline of Physics that states, “simply observing a situation or phenomenon necessarily changes that phenomenon.” This is also true when measuring Linux system performance.
The act of using any monitoring tool alters the system’s use of resources including memory and CPU time. The top utility and most of the other monitors use perhaps 2 or 3 percent of a system’s CPU time. The Glances utility has much more impact than the others and usually uses between 10 and 20 percent of CPU time; I have seen it use as much as 40% of one CPU in a very large and active system with 32 CPUs. That is a lot so you should consider that impact when you think about using Glances as your monitor.
My personal opinion is that this is a small price to pay for those times when the capabilities of Glances are needed.
Summary
Despite its lack of interactive capabilities such as the ability to renice or kill processes, and its own high CPU load, I find Glances to be a very useful tool. The complete Glances documentation is available on the Internet and the Glances man page has startup options and interactive command information.
Author’s note: Parts of this article are based on my new book, Using and Administering Linux: Volume 2 – Zero to SysAdmin: Advanced Topics. ISBN-13: 978-1484254547, Apress, 2019